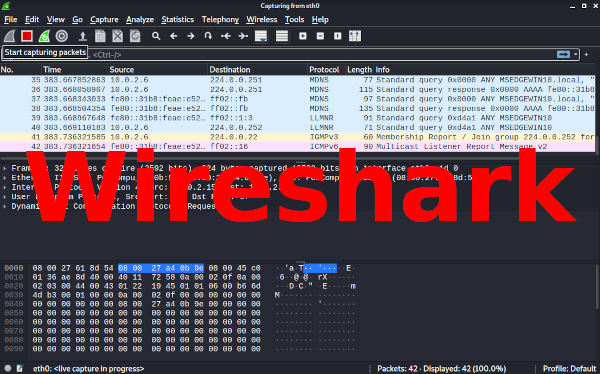
In a previous article, Network Scanning Tools (part 2), we introduced Wireshark describing the tool as:
Wireshark is a network packet analyzer. A network packet analyzer presents captured packet data in as much detail as possible.
You could think of a network packet analyzer as a measuring device for examining what’s happening inside a network cable, just like an electrician uses a voltmeter for examining what’s happening inside an electric cable (but at a higher level, of course).
wireshark.org
Key features of Wireshark include:
- Protocols – deep inspection of hundreds of protocols.
- Analysis – live capture and offline analysis.
- Packet browsing – standard three-pane packet browser.
- Multi-platform – runs on Windows, Linux, macOS, Solaris, FreeBSD, NetBSD, and more.
- Data browsing – captured network data can be browsed via a GUI (Graphical User Interface), or TTY-mode TShark utility.
- Filters – most powerful display filters in the industry.
- VoIP – Rich VoIP (Voice over Internet Protocol) analysis.
- File formats – read/write many different capture file formats: tcpdump (libpcap), Pcap NG, Catapult DCT2000, Cisco Secure IDS iplog, Microsoft Network Monitor, Network General Sniffer (compressed and uncompressed), Sniffer Pro, and NetXray, Network Instruments Observer, NetScreen snoop, Novell LANalyzer, RADCOM WAN/LAN Analyzer, Shomiti/Finisar Surveyor, Tektronix K12xx, Visual Networks Visual UpTime, WildPackets EtherPeek/TokenPeek/AiroPeek, and more.
- Gzip support – capture files, compressed with gzip, can be decompressed on the fly.
- Live data – data can be read from Ethernet, IEEE 802.11, PPP/HDLC, ATM, Bluetooth, USB, Token Ring, Frame Relay, FDDI, and others.
- Decryption – support for many protocols, including IPsec, ISAKMP, Kerberos, SNMPv3, SSL/TLS, WEP, and WPA/WPA2.
- Coloring rules – these can be applied to the packet list for quick, intuitive analysis.
- Exports – output can be exported to XML, PostScript, CSV, or plain text.
Tool Usage
The synopsis or syntax of Wireshark is as follows:
wireshark [ -i <capture interface>|- ]
[ -f <capture filter> ] [ -Y <displaY filter> ]
[ -w <outfile> ] [ options ] [ <infile> ]
Below are the main command line settings:
- -i <capture interface>
- Set the name of the network capture interface or pipe to use for live packet capture.
- -f <capture filter>
- Set the capture filter expression.
- -Y <displaY filter>
- Start with the given display filter.
- -w <outfile>
- Set the default capture file name (outfile), or ‘-‘ for standard output.
For the available ‘options’ please check out the man page using the command ‘man wireshark‘ or click here for an online version.
On many operating systems there will be a desktop icon or menu option to start Wireshark.
Test Environment
For the purposes of this article we will be using Wireshark v3.4.4 installed on a Kali Linux 2021.2 virtual machine (IP = 10.0.2.15) running within VirtualBox 6.1. The target machines are being run as virtual machines on the same NAT Network:
- Metasploitable 2:
- IP = 10.0.2.4
- MAC = 08:00:27:e9:d3:d7
- Ubuntu 21.04:
- IP = 10.0.2.5
- MAC = 08:00:27:cd:fe:4b
- Windows 10:
- IP = 10.0.2.6
- MAC = 08:00:27:42:90:70
Demonstrations
1) Specifying network interfaces
Upon starting up Wireshark there is a prompt to select one or more interfaces to be used for capturing network data e.g. eth0 for a wired connection, wlan0 for a wireless connection. Using the shift key multiple interfaces can be selected.
2) Capturing data from a network interface
Once one or more network interfaces have been selected (see demo #1 above) then capturing can begin by clicking the ‘Start capturing packets’ button (first ‘shark fin’ icon). The captured data will be then be displayed in real time on the main screen:
The main screen is made up of 3 panes for displaying packet data:
- Packet List pane – displays a summary of each packet captured. By clicking on packets in this pane you control what is displayed in the other two panes.
- Packet Details pane – displays the packet selected in the Packet List pane in more detail. Each line can be expanded to display further detail.
- Packet Bytes pane – displays the data from the packet selected in the Packet List pane, and highlights the field selected in the Packet Details pane.
Examples of the above 3 panes can be seen below:
3) Filtering packet data
Items displayed within the Packet List pane can be filtered using the Filter Toolbar. This uses Display Filter Expressions and below is an example of filtering based on IP Address:
Further details on the Filter Toolbar can be found here and information on building Filter Expressions can be found here.
4) Capturing from multiple network interfaces
Capture Options can be accessed via the ‘gear’ icon in the toolbar. This presents a pop-up listing all available network interfaces. Some of the interfaces listed can be expanded to show further details e.g. IP & MAC Addresses:
Multiple interfaces can be selected and clicking the ‘Start’ button will return to the main screen and begin capturing. The example below shows data being captured on eth0 and wlan0 network interfaces:
5) Examples of Statistics
Under the Statistics menu there are a multitude of options. Below shows a selection of them:
Further Information
- Homepage:
- Download:
- Documentation:
Have you used Wireshark for analyzing network traffic? Please share you experience with us in the comments below.


